Fishbone diagram templates
Ishikawa cause-and-effect galleries for root-cause analysis — describe the problem and generate a labeled fishbone diagram.
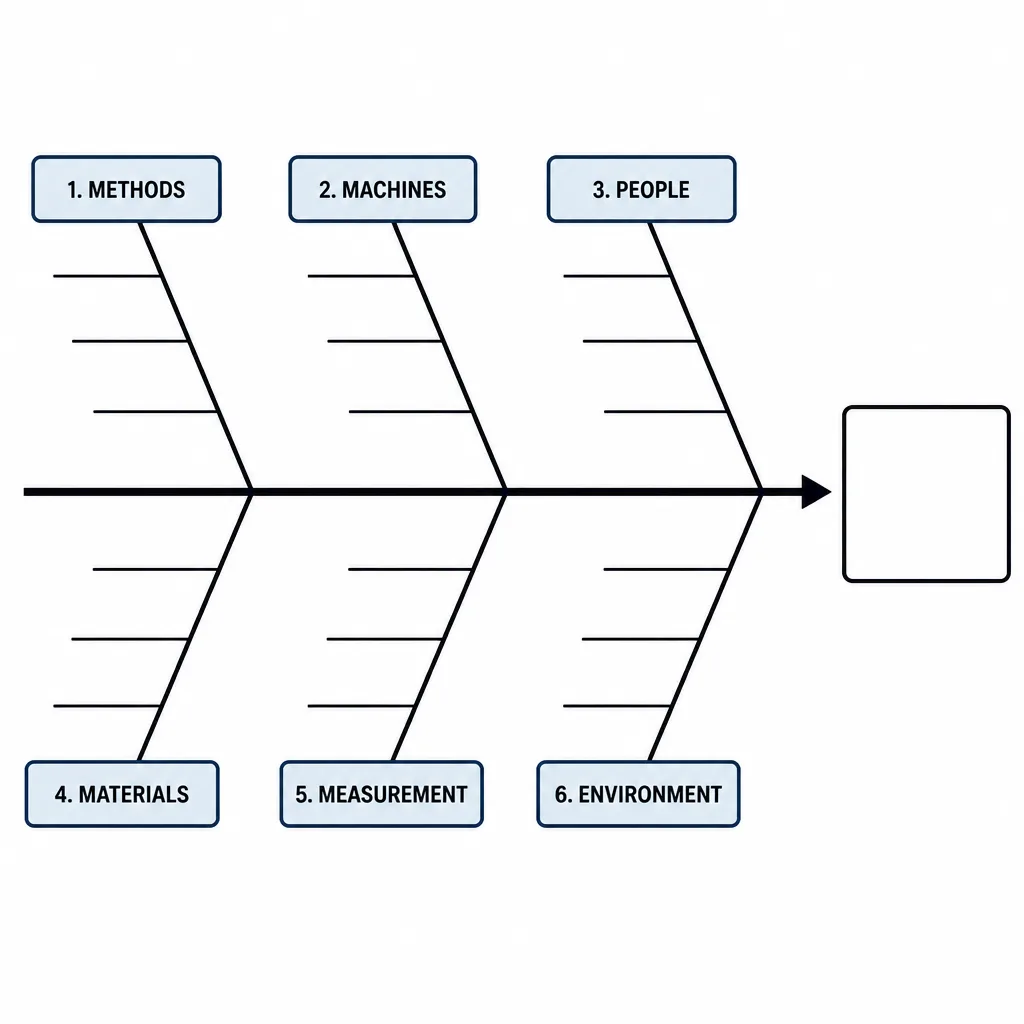
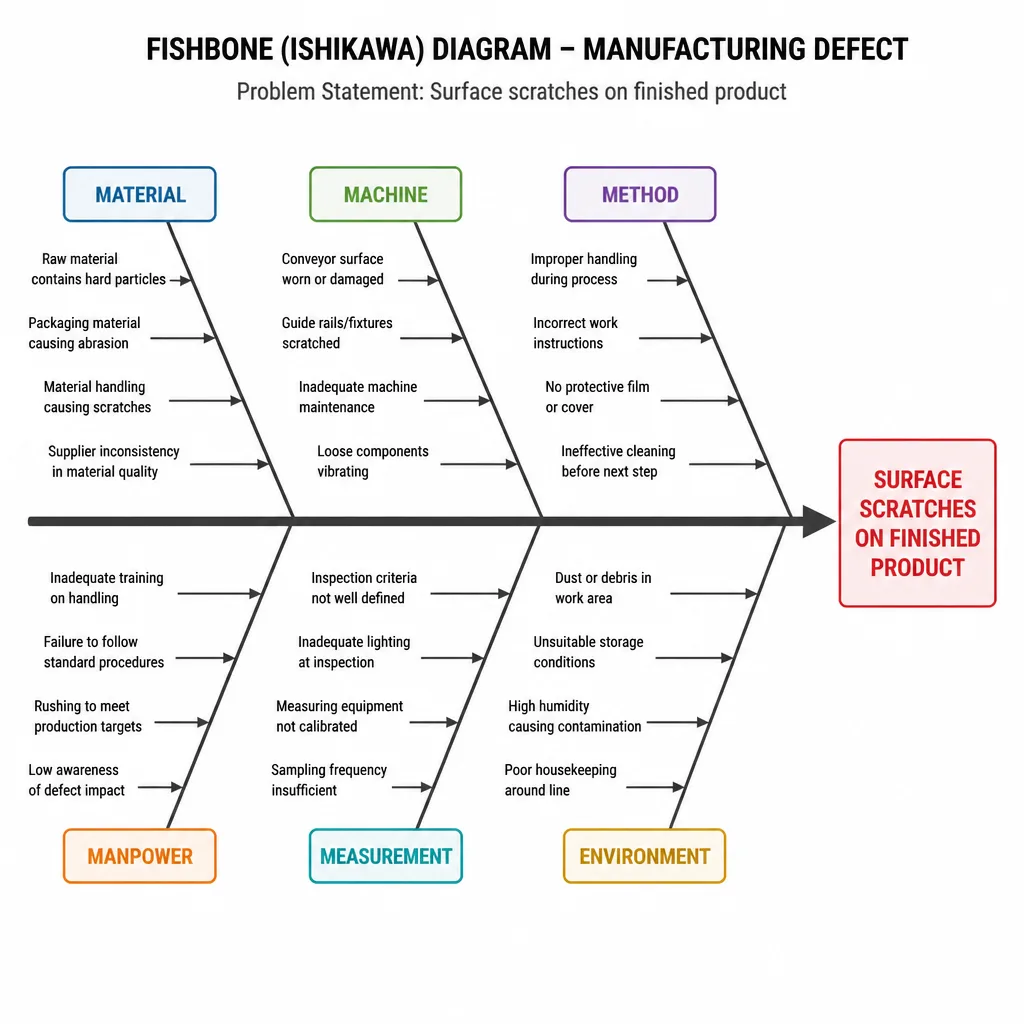
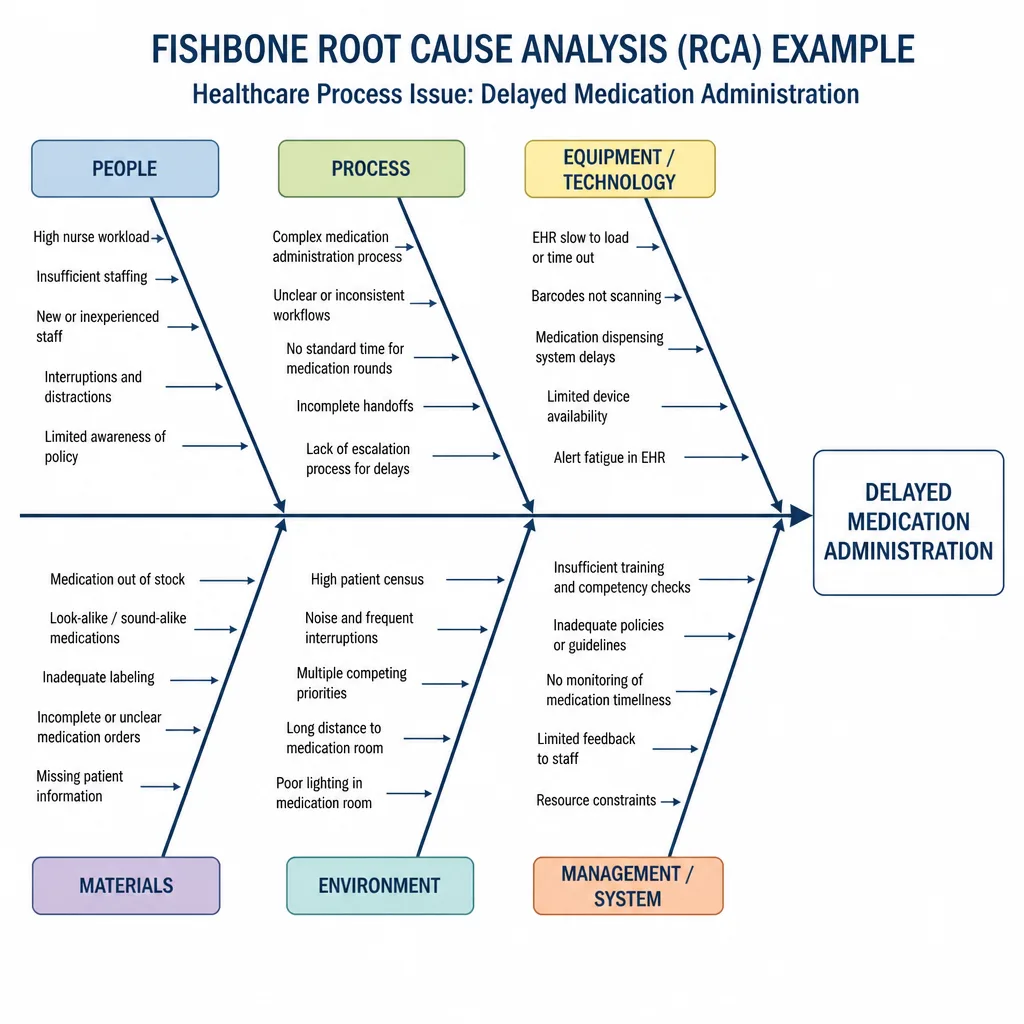
QA and RA teams search for fishbone diagram templates when they need a clear Ishikawa layout for RCA, audits, and quality reviews. QMSFigs generates editable fishbone diagrams from a plain-language description of the effect and contributing causes. Pair this gallery with turtle diagrams and process flowcharts for a complete quality toolkit.
What is a fishbone diagram?
Also called an Ishikawa or cause-and-effect diagram, it organizes potential causes of a problem into categories to support root-cause analysis.
Can I use custom cause categories?
Yes. Name the categories you need and QMSFigs arranges causes under them.
Is this a fishbone diagram maker?
Yes. Describe the problem and causes; QMSFigs generates an editable Ishikawa template.
What other QMS diagrams can I make?
See turtle diagrams, process flowcharts, CAPA maps, and ISO process maps on QMSFigs.