CAPA Diagram Maker
Map a corrective and preventive action workflow into a clear diagram in seconds.
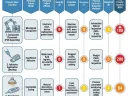
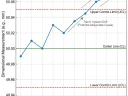
A CAPA is easier to run and audit when the workflow is visible. QMSFigs turns a description of your corrective and preventive action process — from investigation through root cause, action, and verification — into a labeled diagram. Describe the stages and generate a clean visual for your quality system, audit, or training.
What is a CAPA diagram?
It visualizes the corrective and preventive action workflow — investigation, root-cause analysis, corrective action, and verification of effectiveness.
Can I include root-cause analysis?
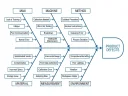
Yes. Pair it with a fishbone or 5-why description and the AI reflects the analysis steps in the workflow.
Can I refine the diagram?
Yes. Adjust your description to add or reorder stages and regenerate.
Is it audit-ready?
Figures export at high resolution suitable for quality records, audits, and training.